
When approaching the placement of visuals on a dashboard, to be as clear and understandable as possible and to avoid an overwhelming dashboard, the principles of Gesltat are here to help you.
These are principles (we will use 6 of them) that illustrate how humans naturally interact with and order visual stimuli.
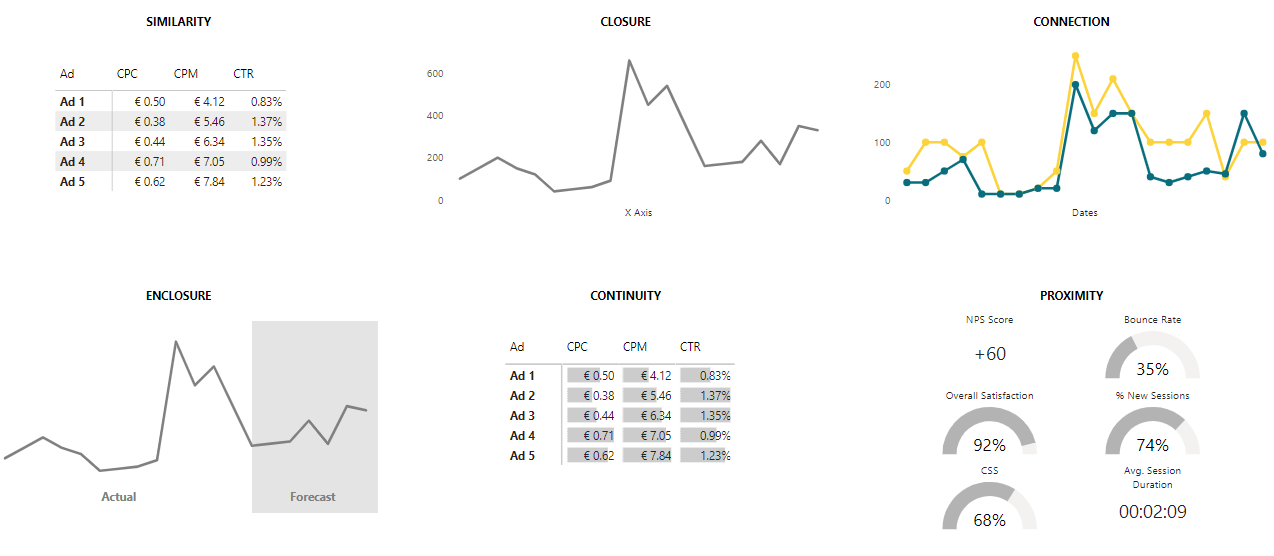
Six Gestalt principles will be discussed and put into practice: proximity, similarity, enclosure, closure, continuity and connection.
Gestalt principle: proximity
We tend to think that objects that are physically gathered together are part of the same group.
If in the image on the left, there is no link or differentiation between the 9 KPIs, you can enlarge the space between the columns to distinguish the three themes of the dashboard.

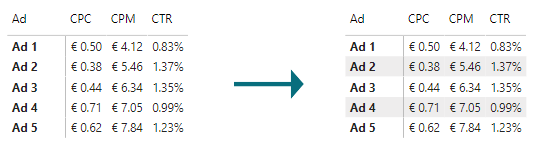
Gestalt principle: similarity
In data visualisation, objects that have similar colours, shapes, sizes or orientation are perceived as part of the same group.
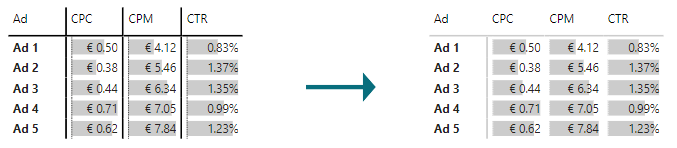
Highlighting every other line in a table with a neutral colour makes it easier to read horizontally without having to add borders that would add noise to the view.
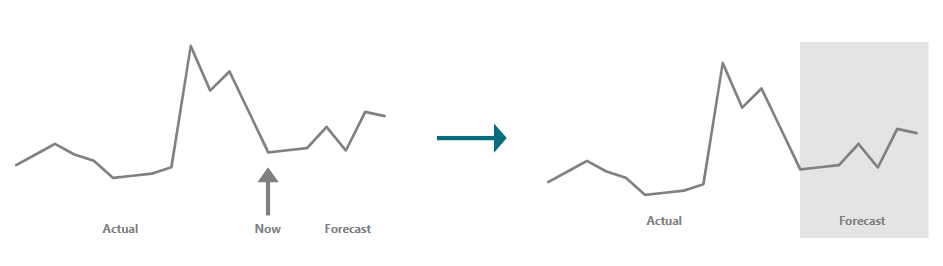
Gestalt principle: enclosure
Objects that are physically circled, even slightly, are thought to belong to the same group.
Instead of creating several graphs to illustrate the same KPI in different contexts, one can circle these different contexts in the same graph. In the example, the forecast is circled in grey to distinguish it from the present.
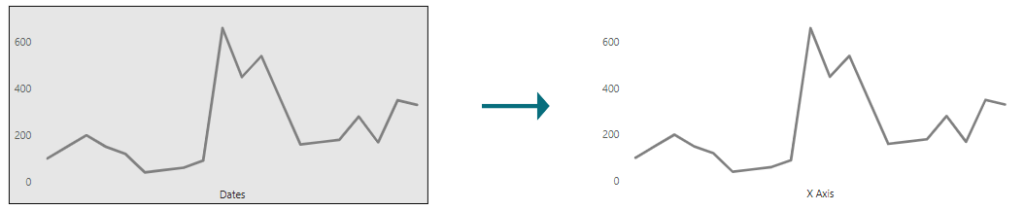
Gestalt principle: closure
Our brain will naturally simplify the reading of a visual, by putting the elements together as part of a whole.
It is therefore not necessary to accentuate the outline of a graph or to add a coloured background if the graph has X and Y axes that already delimit it.
Gestalt principle: continuity
Humans will naturally imagine a logical sequence and continuity in an image, even if it is broken.
In the table opposite, it is not necessary to add borders at the beginning of each column. Our eye immediately understands that we are dealing with three columns because of the space between each column and the fact that the bar starts at the same place in each column.
Gestalt principle: connection
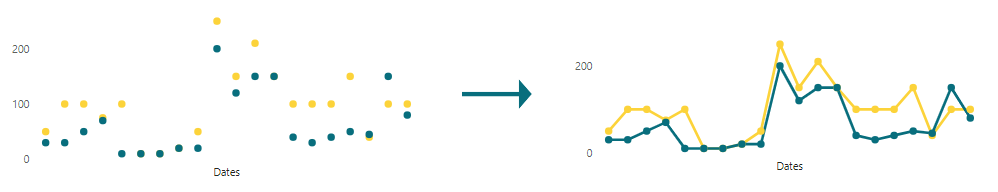
This last principle, and one of the most important, explains that visual elements, if joined by a continuous visual element (a line), are perceived as belonging to the same group.
In the line graph below, it was necessary to join the points of the same colour by a line to understand immediately that there are two lines. The principle of connection is therefore stronger than that of similarity.